A few months ago, I shared an app I built to visualize Immigration Enforcement data. One pattern stood out: ICE arrests were up this year, but CBP arrests were down. At the time, I didn't know why.
Recently, I spoke with a statistician at DHS who pointed me to a dataset I hadn't worked with before-"CBP Encounters." His hypothesis was that fewer people are crossing the border under the current administration, and that migration patterns often shift with policy changes. I decided to dig in.
Short answer: I think he was right.
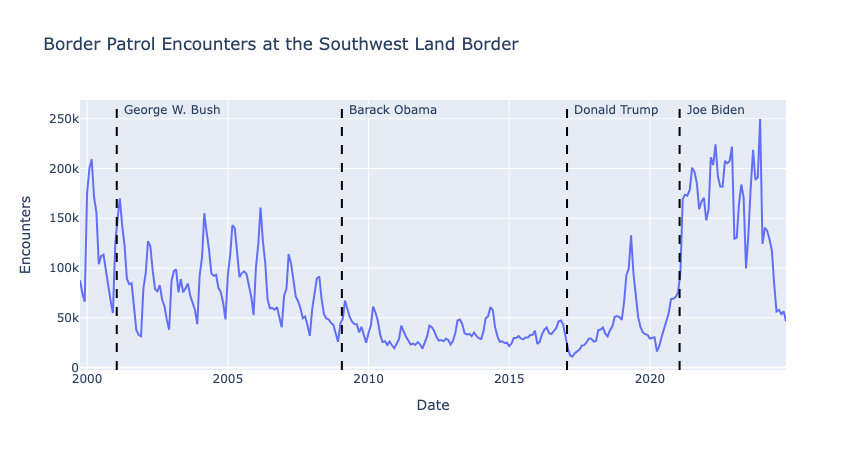
I wrote a blog post exploring this in more detail: Visualizing 25 Years of Border Patrol Data with Python. Here's the key graphic from the post, showing monthly encounters at the Southwest border across four administrations:
 The code behind the analysis is open source, so feel free to use it as a starting point for your own projects. Would love to hear from anyone who's worked with CBP data or explored similar questions.
Blog link: https://arilamstein.com/blog/2025/10/06/visualizing-25-years-border-patrol-data-python/
------------------------------
Ari Lamstein
------------------------------